How does the Sample rate affect the data?
We have previously discussed what aspects of the data are captured by different vibration metrics and how the Nyquist frequency affects your signal. In this article, we will synthesize these concepts to demonstrate how varying sampling rates influence signal quality and the accuracy of vibration metrics.
The sampling rate or sampling frequency is crucial for acquiring high-fidelity measurements. It defines the interval at which vibration data is recorded, directly affecting the precision and reliability of signal analysis. Choosing the right sampling frequency is imperative for accurately reflecting the machine’s condition, facilitating early fault detection and effective maintenance.
Inadequate sampling frequency can result in the loss of critical details, leading to incomplete or erroneous analysis. Conversely, excessively high sampling rates may introduce high-frequency noise, complicating data interpretation and escalating costs due to the necessity of advanced hardware. Comprehending and implementing the optimal sampling frequency is vital for vibration experts to monitor machinery health and detect potential issues promptly.
Determining the appropriate sampling rate for a sensor involves balancing the expected vibration frequencies of the machinery (such as bearing characteristic frequencies) and the sensor’s limitations (including transmission, storage, mounting, and hardware constraints). Understanding the sensor’s maximum frequency (fmax) dictated by its hardware is essential when setting the sampling rate. The chosen sampling rate significantly impacts both vibration metrics and spectral analysis.
There are many different effects of different sample rates for example under or over sampling but this article will focus on how it affects the vibration metrics.
Effects on vibration metrics
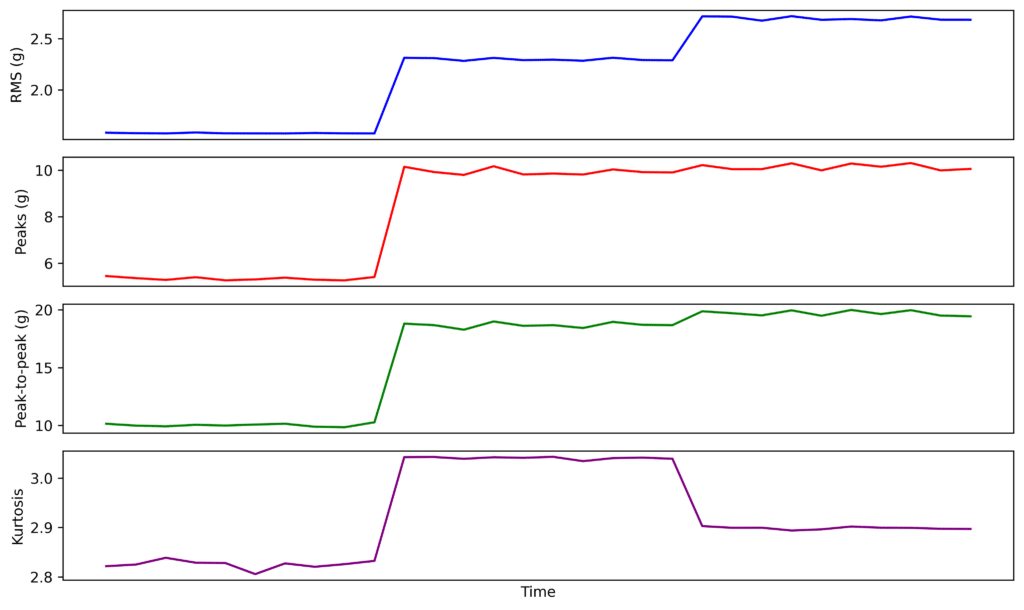
If we look at a trend of different vibration metrics, we see that the metrics capturing amplitude are increasing with time. This could be signaling some issue with the machine. We will see something interesting if we look at a measurement of the trend’s beginning, middle, and end.
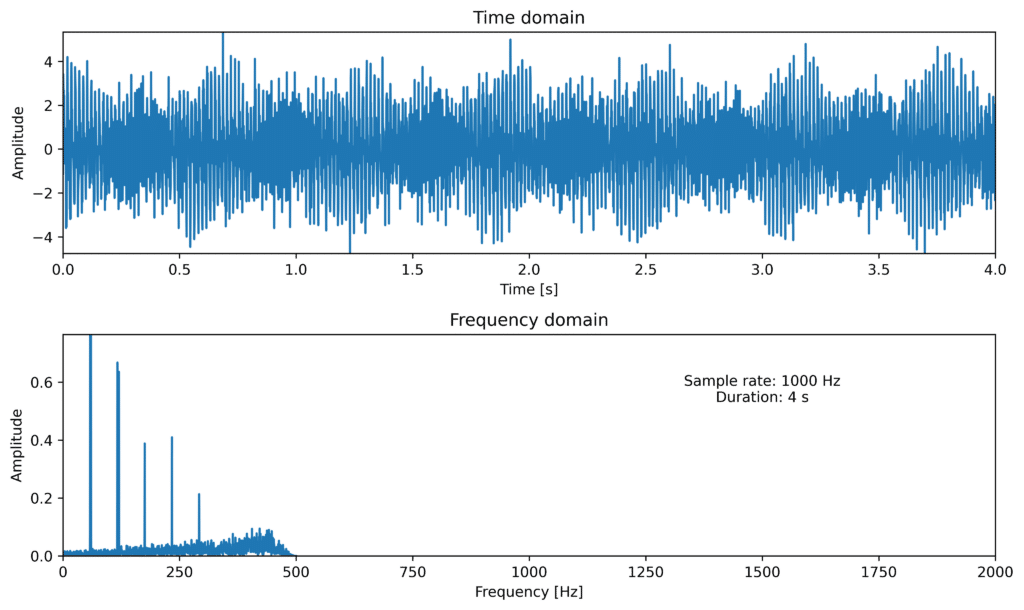
In the first measurements, we see some peaks in the lower frequencies and some noise in between. Here the sample rate is 1000 Hz.
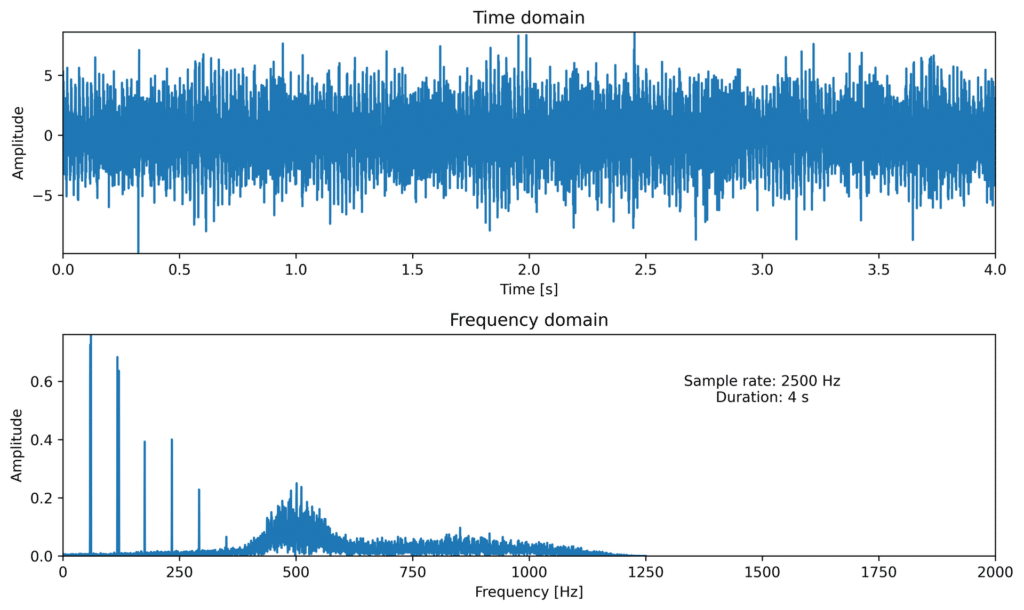
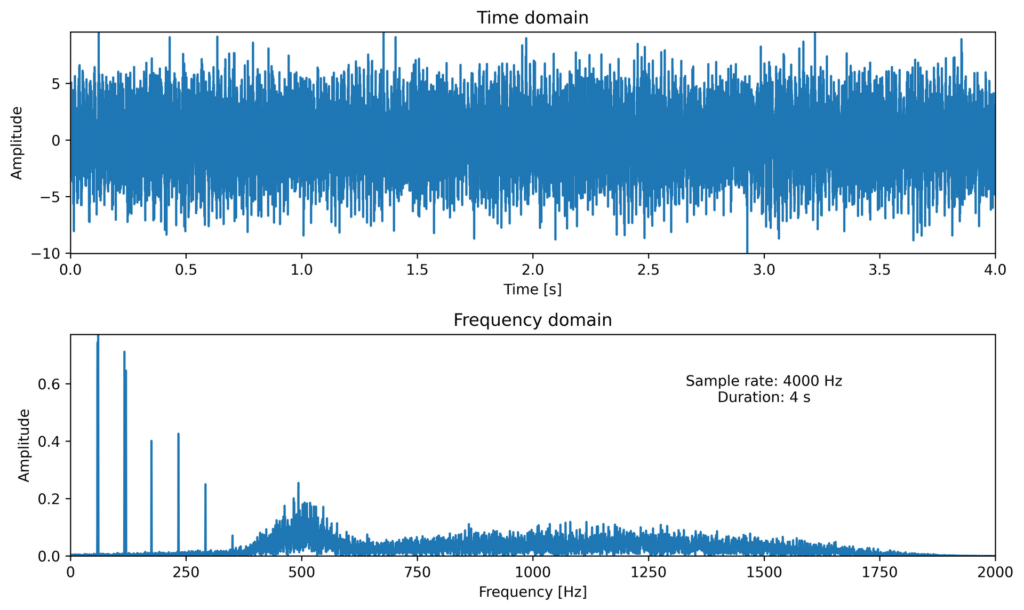
In the last measurement, we see the same things as in the two previous but with more noise in the higher frequencies. Here the sample rate has increased to 4000 Hz.
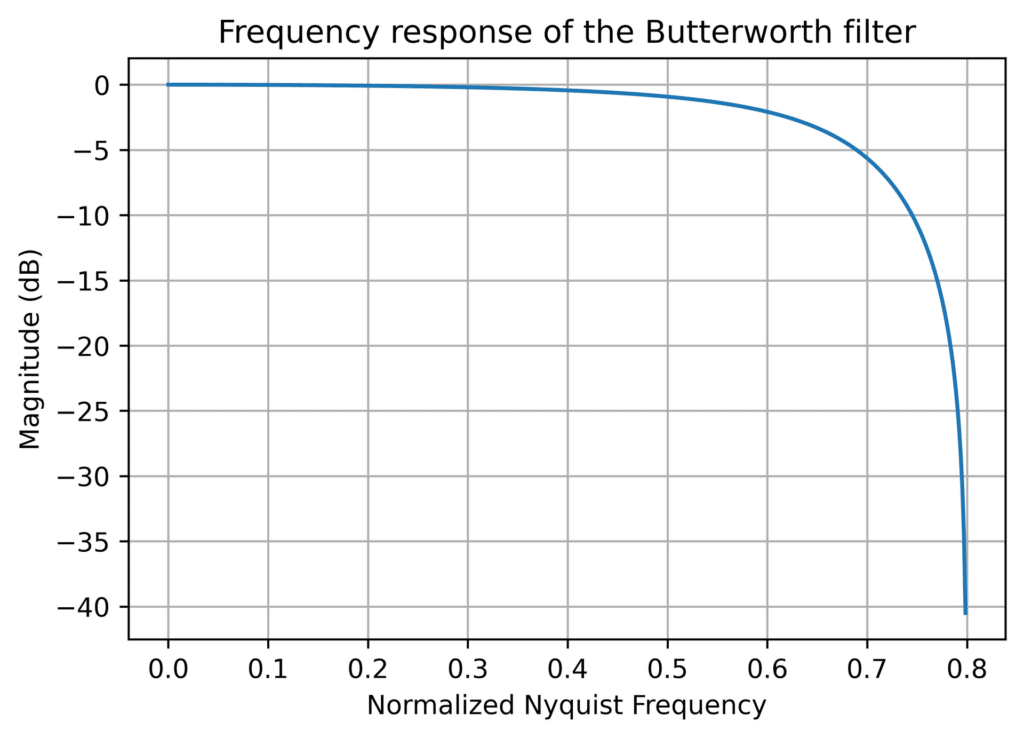
We see the vibration metrics start to diverge since some signals are cut away by the low-pass filter, which is normally part of the sensor, to avoid aliasing, as we described in a previous article. In this case, the cut-off frequency is set to 80% of the Nyquist frequency. This, however, is not true for the kurtosis in this case, since it is just random noise we have added that cancels itself out and has a kurtosis of 3.
Conclusions
We see that the sample rate used affects both the spectrum and the vibration metrics capturing amplitude. Therefore measurements with different sample rates are unfit for comparison, both in terms of the vibration metrics measuring amplitude and in terms of spectrum. Even the parts under the Nyquist frequency can differ if the signal has components that are of higher frequency than the Nyquist frequency. This also means that, when setting thresholds, the sample rate must be considered, and the thresholds must be updated if the sample rate is changed.

