How does duration impact the spectrum
Previously, we discussed how the sample rate setting affects the data. Now, we dive deeper into another setting: duration and also discuss when you should have different durations and sample rates.
Duration
The frequency resolution will be inverse of the duration (frequency resolution = 1/duration), in other words, if we have a duration of 1 s, the distance between two points in the FFT will be 1 Hz away from each other, and if you have a duration of 2 s, the distance between two points in the FFT will be 1/2 Hz from each other.
To demonstrate the effects of varying duration, we constructed synthetic data with a rotational speed of 58.4 Hz and vibrations from the electrical network at 60 Hz, including harmonics.

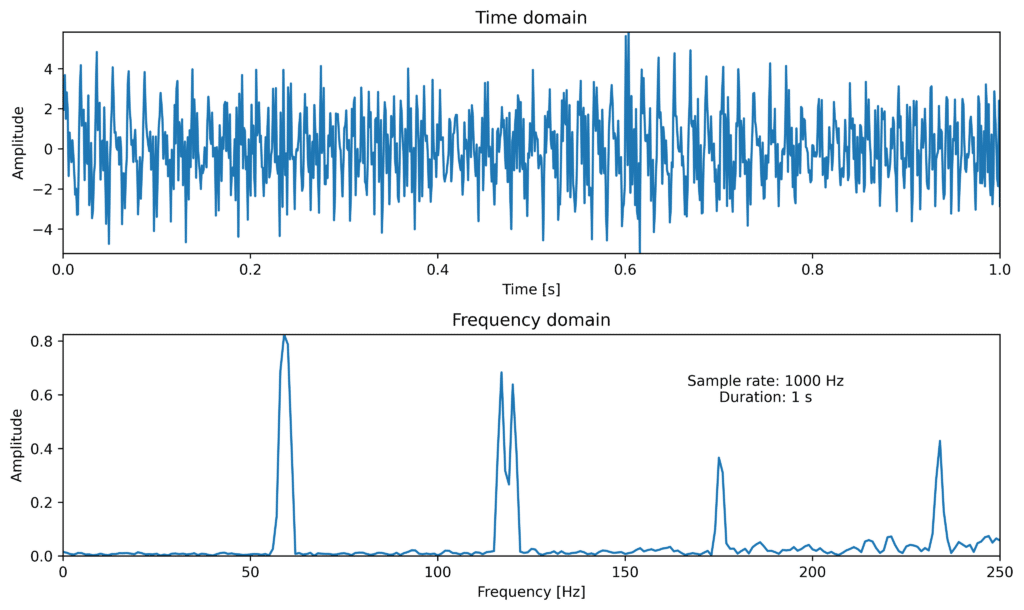
Here, we observe a large, wide peak at 59 Hz and a double peak at 118 Hz and 120 Hz. Since we know the data we know that the first peak is two that have merged and the double peak is also two that have almost merged.

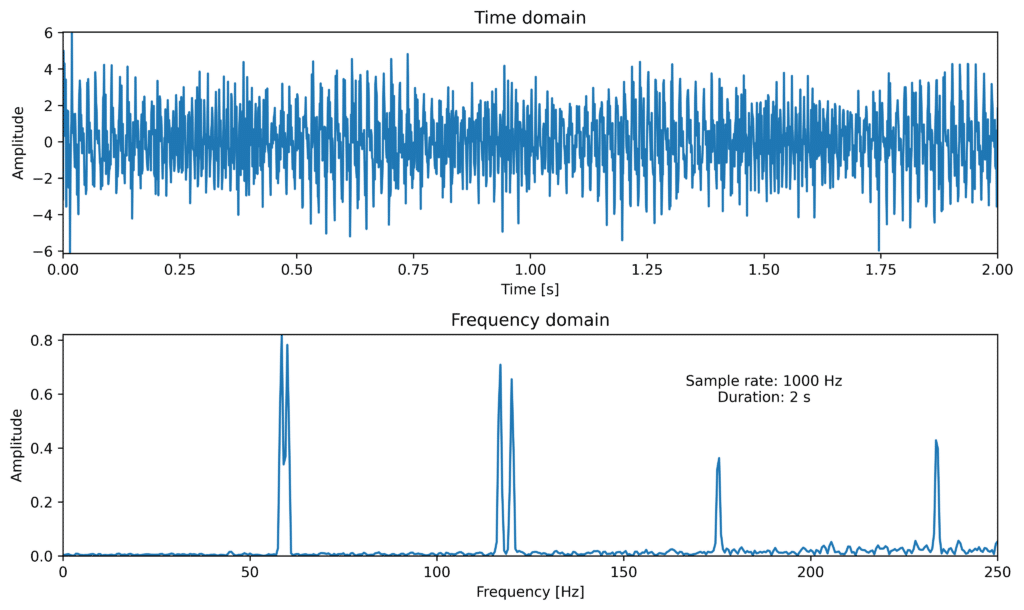
In the second case, we notice that the first peak is splitting up and the second peak is two different.

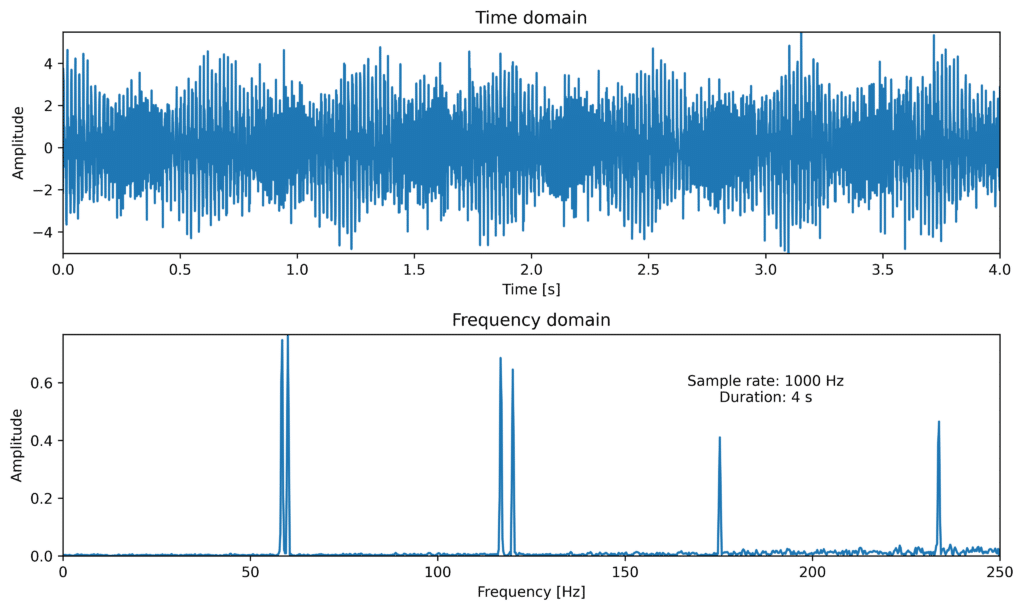
In the last case, the first peak has split up and the second is two different. We also observe that the signals stand out more from the noise, as the peaks become sharper with a longer duration.
Connection between Duration and Sample Rate
Many sensors have made a connection between duration and sample rate. This is to make sure users can not have high sample rates and duration at the same time since that would require significant memory for the sensor and deplete the battery faster. This usually means that if you increase the duration you will lower the sample rate thereby keeping the number of data points in the measurement constant.
Changing Duration and Sample Rate
If you compare the different spectrums from both this article and last week’s article you see that the picture you get of the machine vibrations is quite different, even though this is the same signal behind. This means that you cannot compare signals with different sample rates and durations. Therefore, it is important to set up these settings right from the beginning to avoid neglecting large amounts of data gathered, should you later change settings after discovering they were initially incorrect.
Trends will also be invalid for comparison across different sample rates, effectively negating the purpose of saving historical data for future reference.
Conclusions
Duration and Sample rate are two of the most central settings in vibrational monitoring and it is crucial to get them right from the beginning to not have to change them and discard historical data.
To be able to set them right it is important to answer a few questions
-
What is the expected rotational speed? If it is low or close to the electrical frequency, a longer duration is important, if it is high and far from the electricity grid frequency, a longer duration is not important.
-
What are the most likely failures I want to keep track of? If the primary faults manifest in low frequencies (e.g., unbalance, misalignment, looseness) – a longer duration is needed. If it is mostly faults manifesting in higher frequencies (bearing failures, lubrication failures, etc.), a higher sample rate is needed.
-
Do I expect peaks close to each other at low frequencies? If yes, a longer duration is needed.

