How to set the dynamic range and what are the consequences of poor setting
We have previously discussed the sensor settings sample rate and duration in this article we will discuss the last one, dynamic range. If these are set correctly, gathering the data needed to monitor your assets with high quality will be easy. If set poorly, it might lead to incorrect assessments of the machine. Here is a guide on how to set the parameter Dynamic Range, along with examples of what might happen if it is set poorly.
Set up
When setting up a sensor for a machine one needs to know approximately what magnitude of vibrations the machine will produce, for example, a fan might produce way less vibrations than a mixer. The sensors usually have a few predefined alternatives to choose from, select the one above what you think the machine might experience in a worst-case scenario.
What happens if set too high
If the dynamic range is set too high, the signal will not utilize the full range possible and will be forced into only a few possible values. This might happen faster for some sensors than others due to the number of bits used to store values. For example, some sensors only use 8 bits while others use 16 bits, the sensors that only use 8 bits will use less energy and therefore usually have a longer battery life but will need to be set up more accurately to gather good data. Setting the dynamic range too wide results in a distortion of the signal from the actual machine vibrations.

Figure 1: Here, we see the distortion. The top panel only has 3 bins, making it hard to discern the signal’s characteristics.
The middle one is better since it has 9 bins and the last one is the original signal. The signal has a 3.14 s duration and a sample rate of 955 Hz.
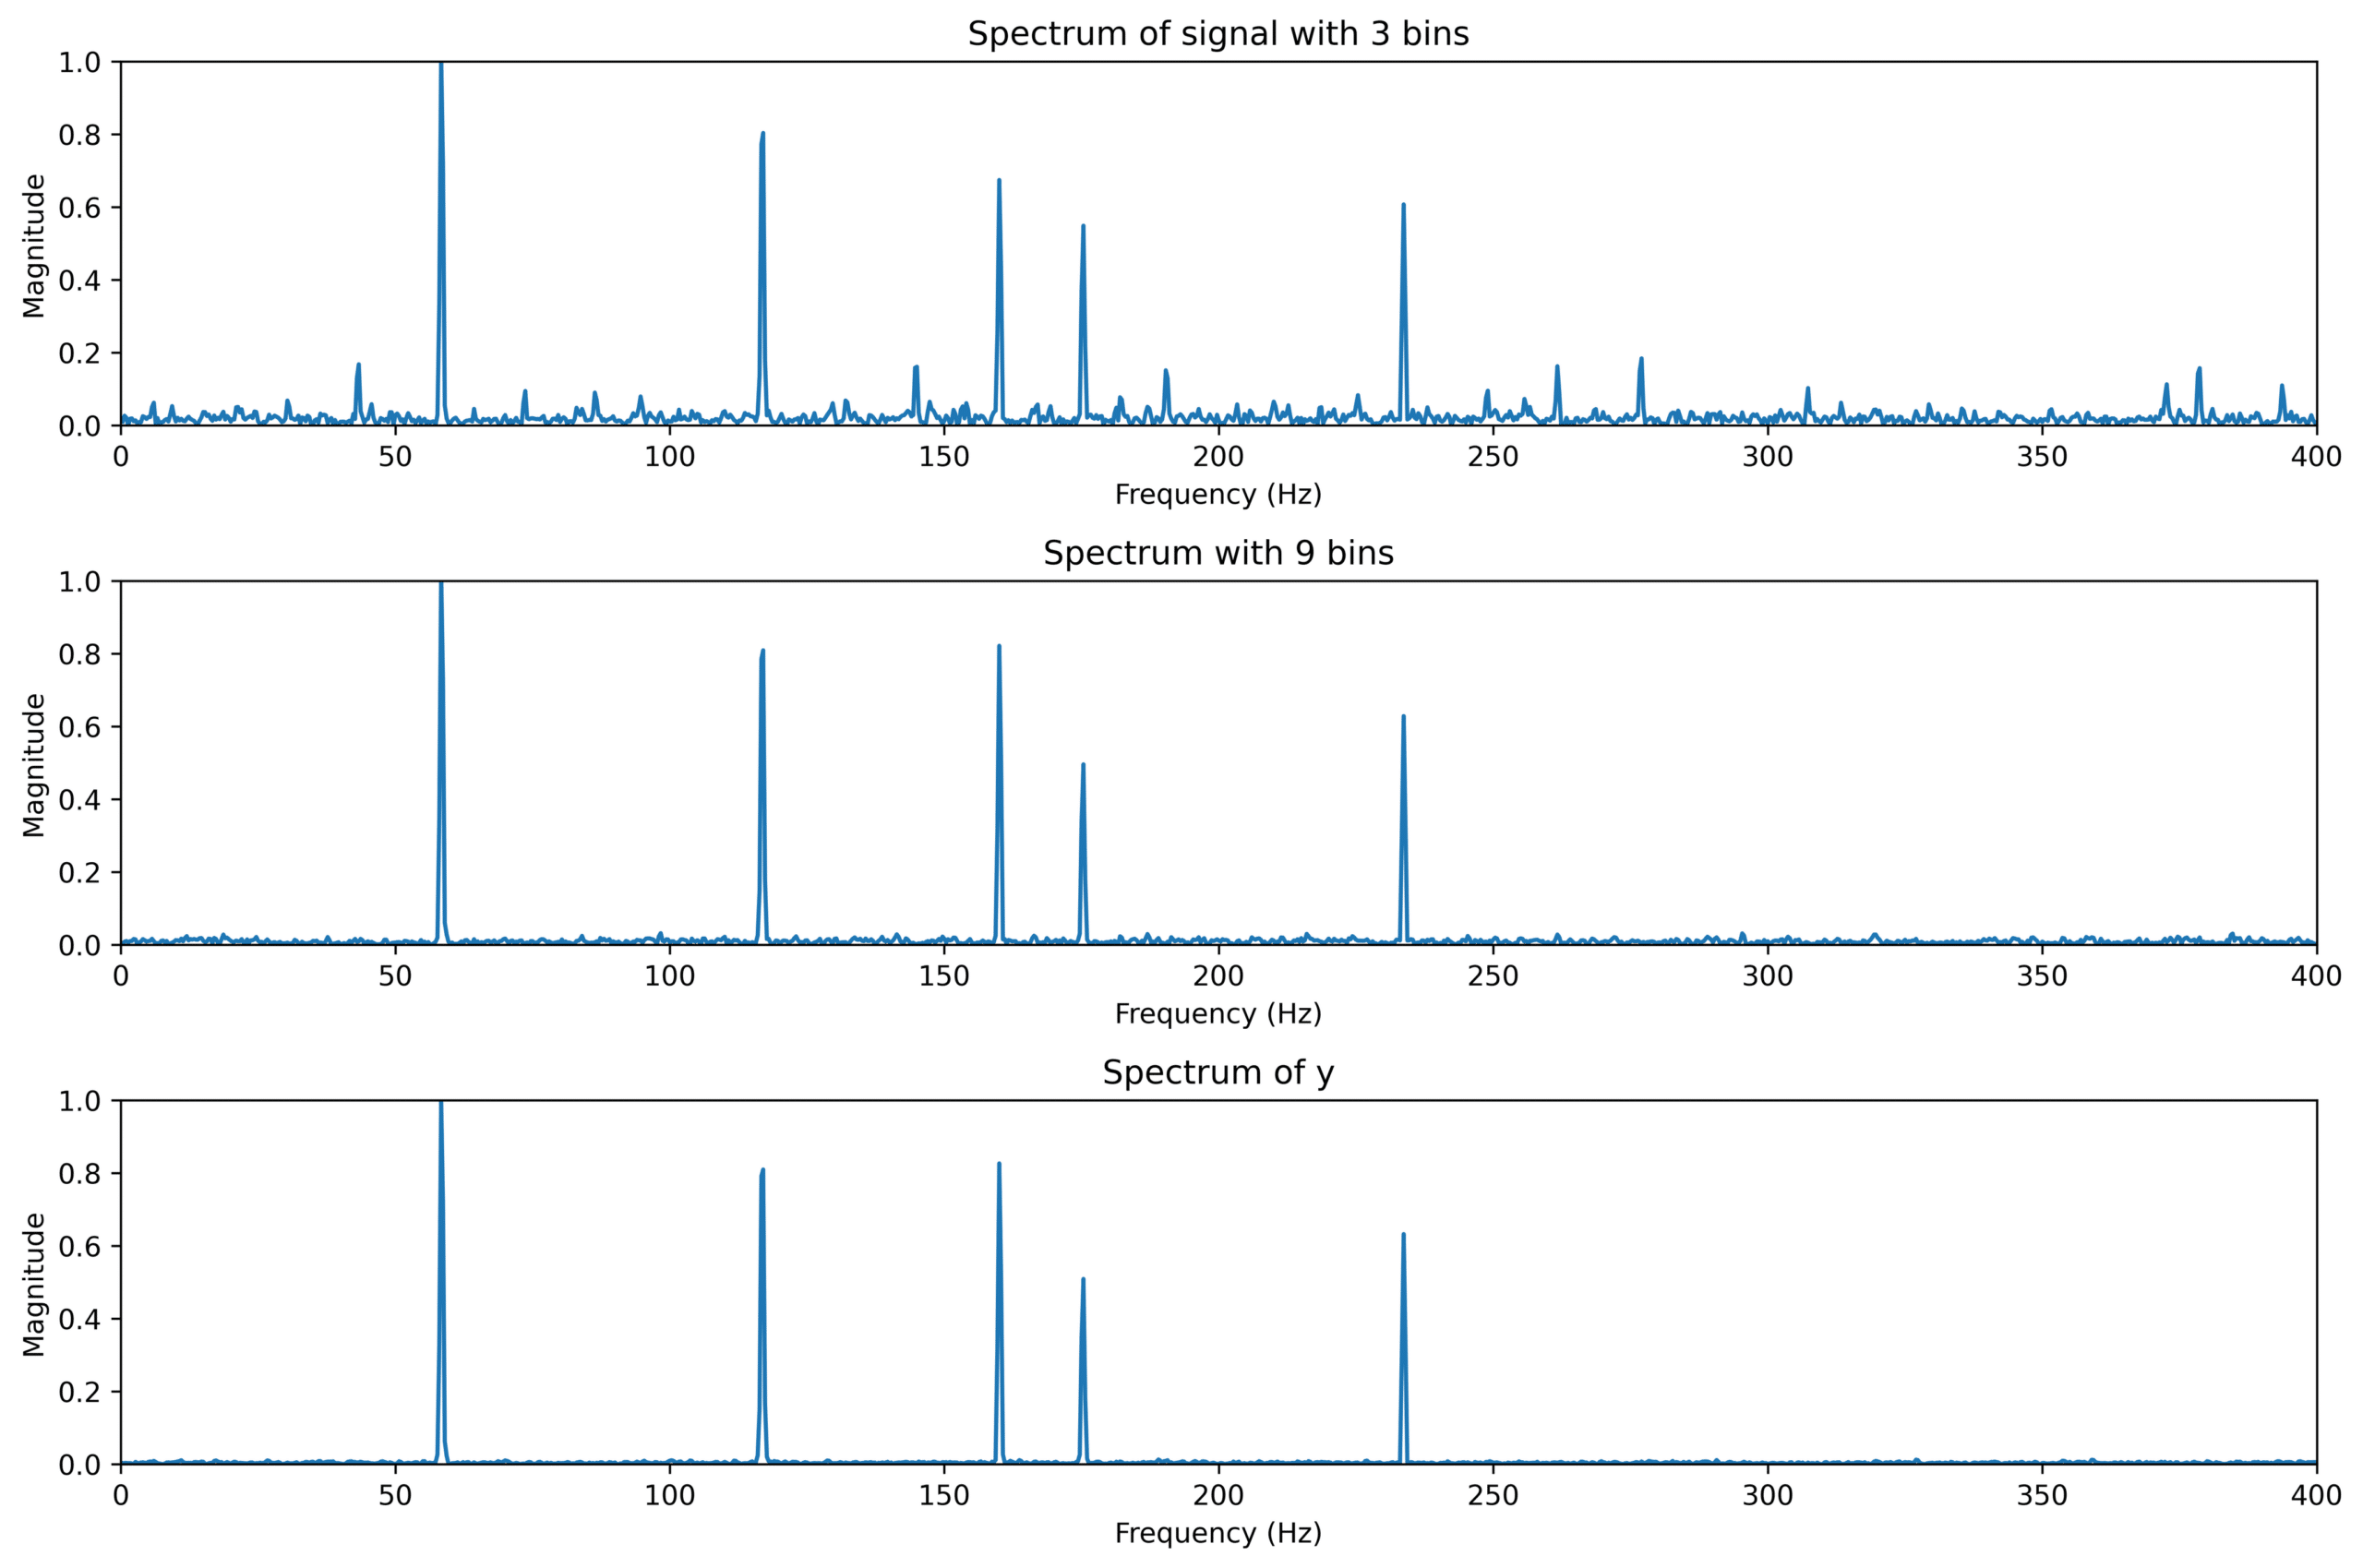
If we transform these three different representations of the signal to their respective spectrums, we see that we get significantly more noise when we have a higher dynamic range.

Figure 2: Here we see the consequences of having a too-high dynamic range, in the top panel which is the spectrum of the most distorted signal we see that there are lots more peaks and noise compared with the two others. However, it is not a large difference between the middle panel which is the spectrum of the distorted signal with 9 bins, and the bottom panel which is the spectrum of the original signal.
The first spectrum could be interpreted as something in the machine happening and causing a lot of noise and some small peaks. But since we know the waveform was distorted we know this is just an effect of the dynamic range settings.
What happens if set too low
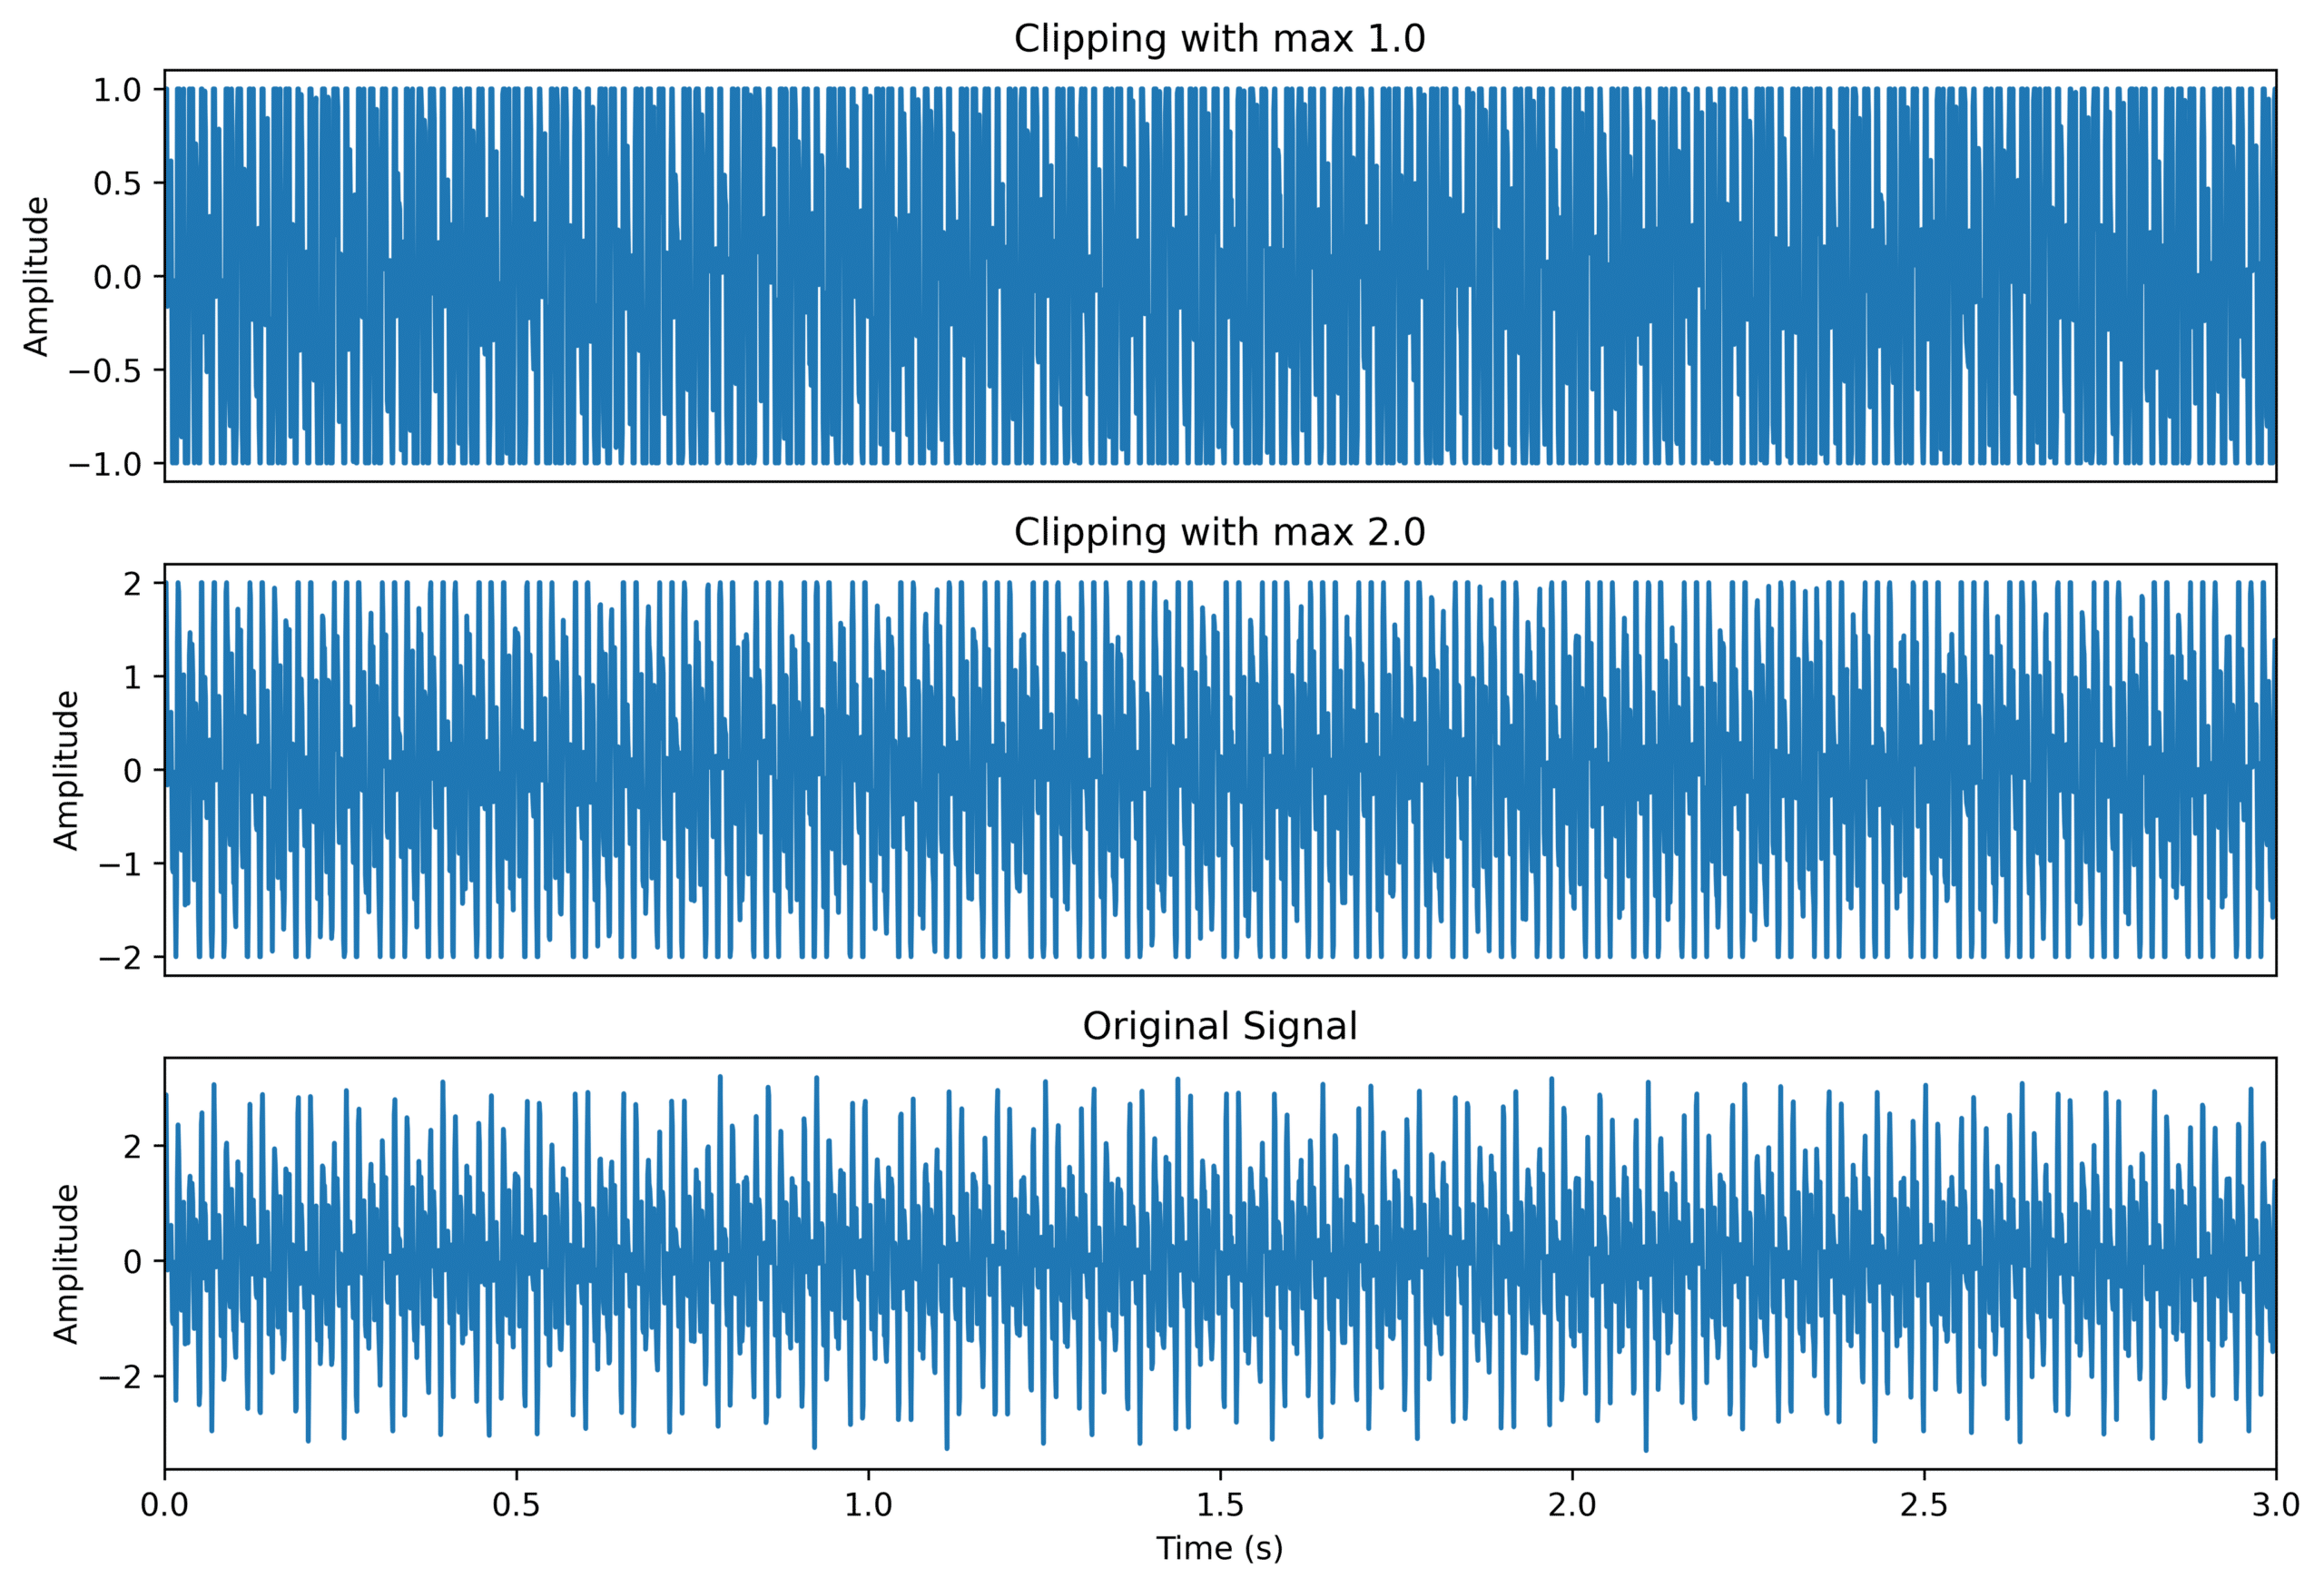
If the Dynamic Range is set too low, the signal will be clipped at the Dynamic Range, causing distortion.

Figure 3: Here we see how it would look if the dynamic range were set to 1, 2, or 3. In the middle panel, it is set to two which clips the signal just a bit. The signal has a 3.14 s duration and a sample rate of 955 Hz.
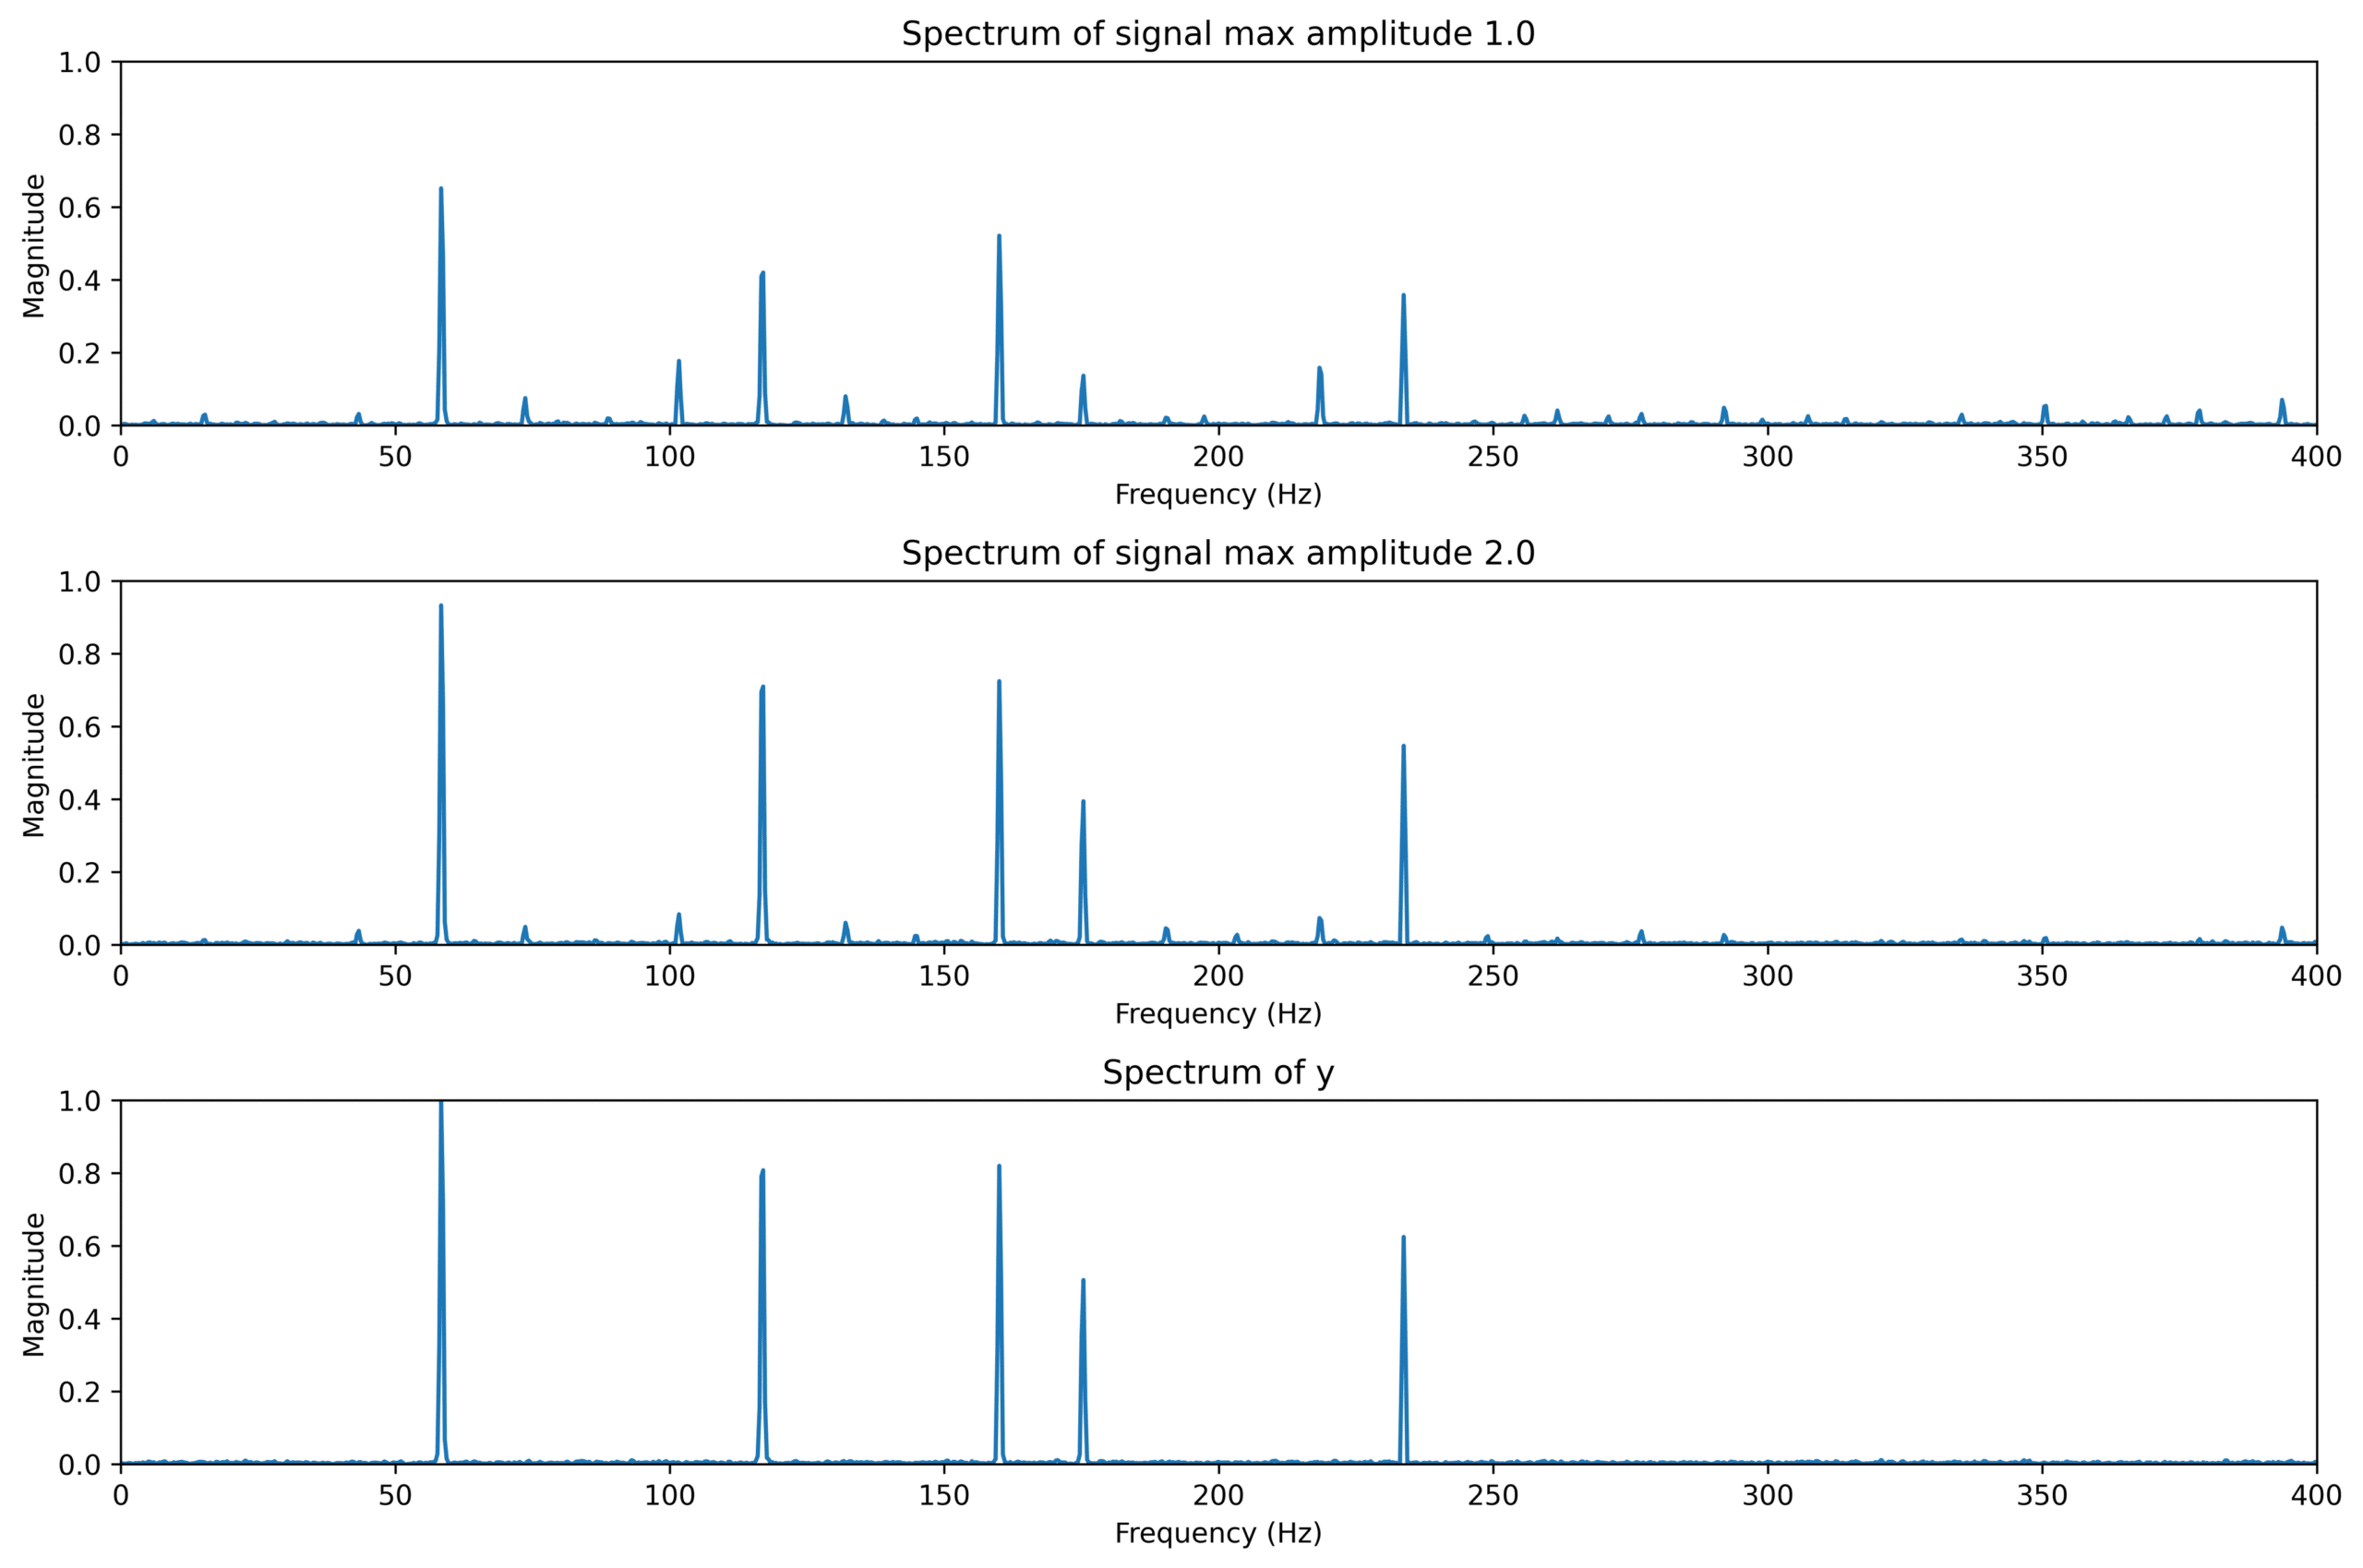
If we transform this to its respective spectrum we will see how much they get distorted.

Figure 4: Here we see that the distortion caused by the wrong setting in the dynamic range significantly changes the spectrum even in the middle panel where it just clips the signal slightly.
In the spectrums above we see that when the dynamic range is set to 1 it gives a lot of small peaks that should not be there and lowers the peaks that should be there, making them more or less comparable. In the middle example with a dynamic range equal to 2, we see that by clipping the signal slightly, we introduce many small peaks without significantly lowering the signal’s amplitude. This also means that KPIs such as RMS, peak-to-peak, and peak will be bounded by the Dynamic Range and cannot exceed that value. Kurtosis will also be suppressed since the peaks in the signal get cut off.
Conclusions
Setting up the dynamic range can be a challenging task and it can give a false impression of what is happening in the machine. To set it up appropriately one needs to know some details of the machine and perhaps test a few different settings. It is also hard to tell by a spectrum if the dynamic range is set correctly or not since even a very distorted signal can create a spectrum that looks good. The only way to ensure it is set correctly is to check every waveform. Fortunately, MultiViz already checks each measurement and warns if it is too low or too high, allowing you to easily adjust.


